
Interconnected by nature
Changes in one area influence others.
Use the Body Map to capture signals across 12 areas, so you can clearly see how everything connects.
What it is
Discover your PULSE® is a diagnostic framework and digital platform that uses a body map to help you see, understand, and act on signals of strain and strength across your system.
Inspired by medicine and the human body, it brings everything together, making it easier to see what is happening beneath the surface.
Changes in one area influence others.
Use the Body Map to capture signals across 12 areas, so you can clearly see how everything connects.

Signals are not conclusions.
Interpret them in context to uncover patterns, underlying causes, and the conditions shaping what is happening.

Start with clarity before you act.
Action follows understanding, ensuring responses address underlying conditions, not just visible effects.

Adapt as conditions evolve.
Monitor change, reassess progress, and keep actions aligned as your system develops.
Think of it like a continuous health check for your system,
helping you maintain balance and direction as conditions change.
The Framework
At the core of Discover your PULSE® is the Body Map.
Every system has underlying structures that shape how it behaves.
Discover your PULSE® makes these structures visible, helping you see patterns, connections, strengths, and areas of strain that are often missed.
Signals appear across different parts of your system. The Body Map brings them into view.
This framework helps you:
In the Platform
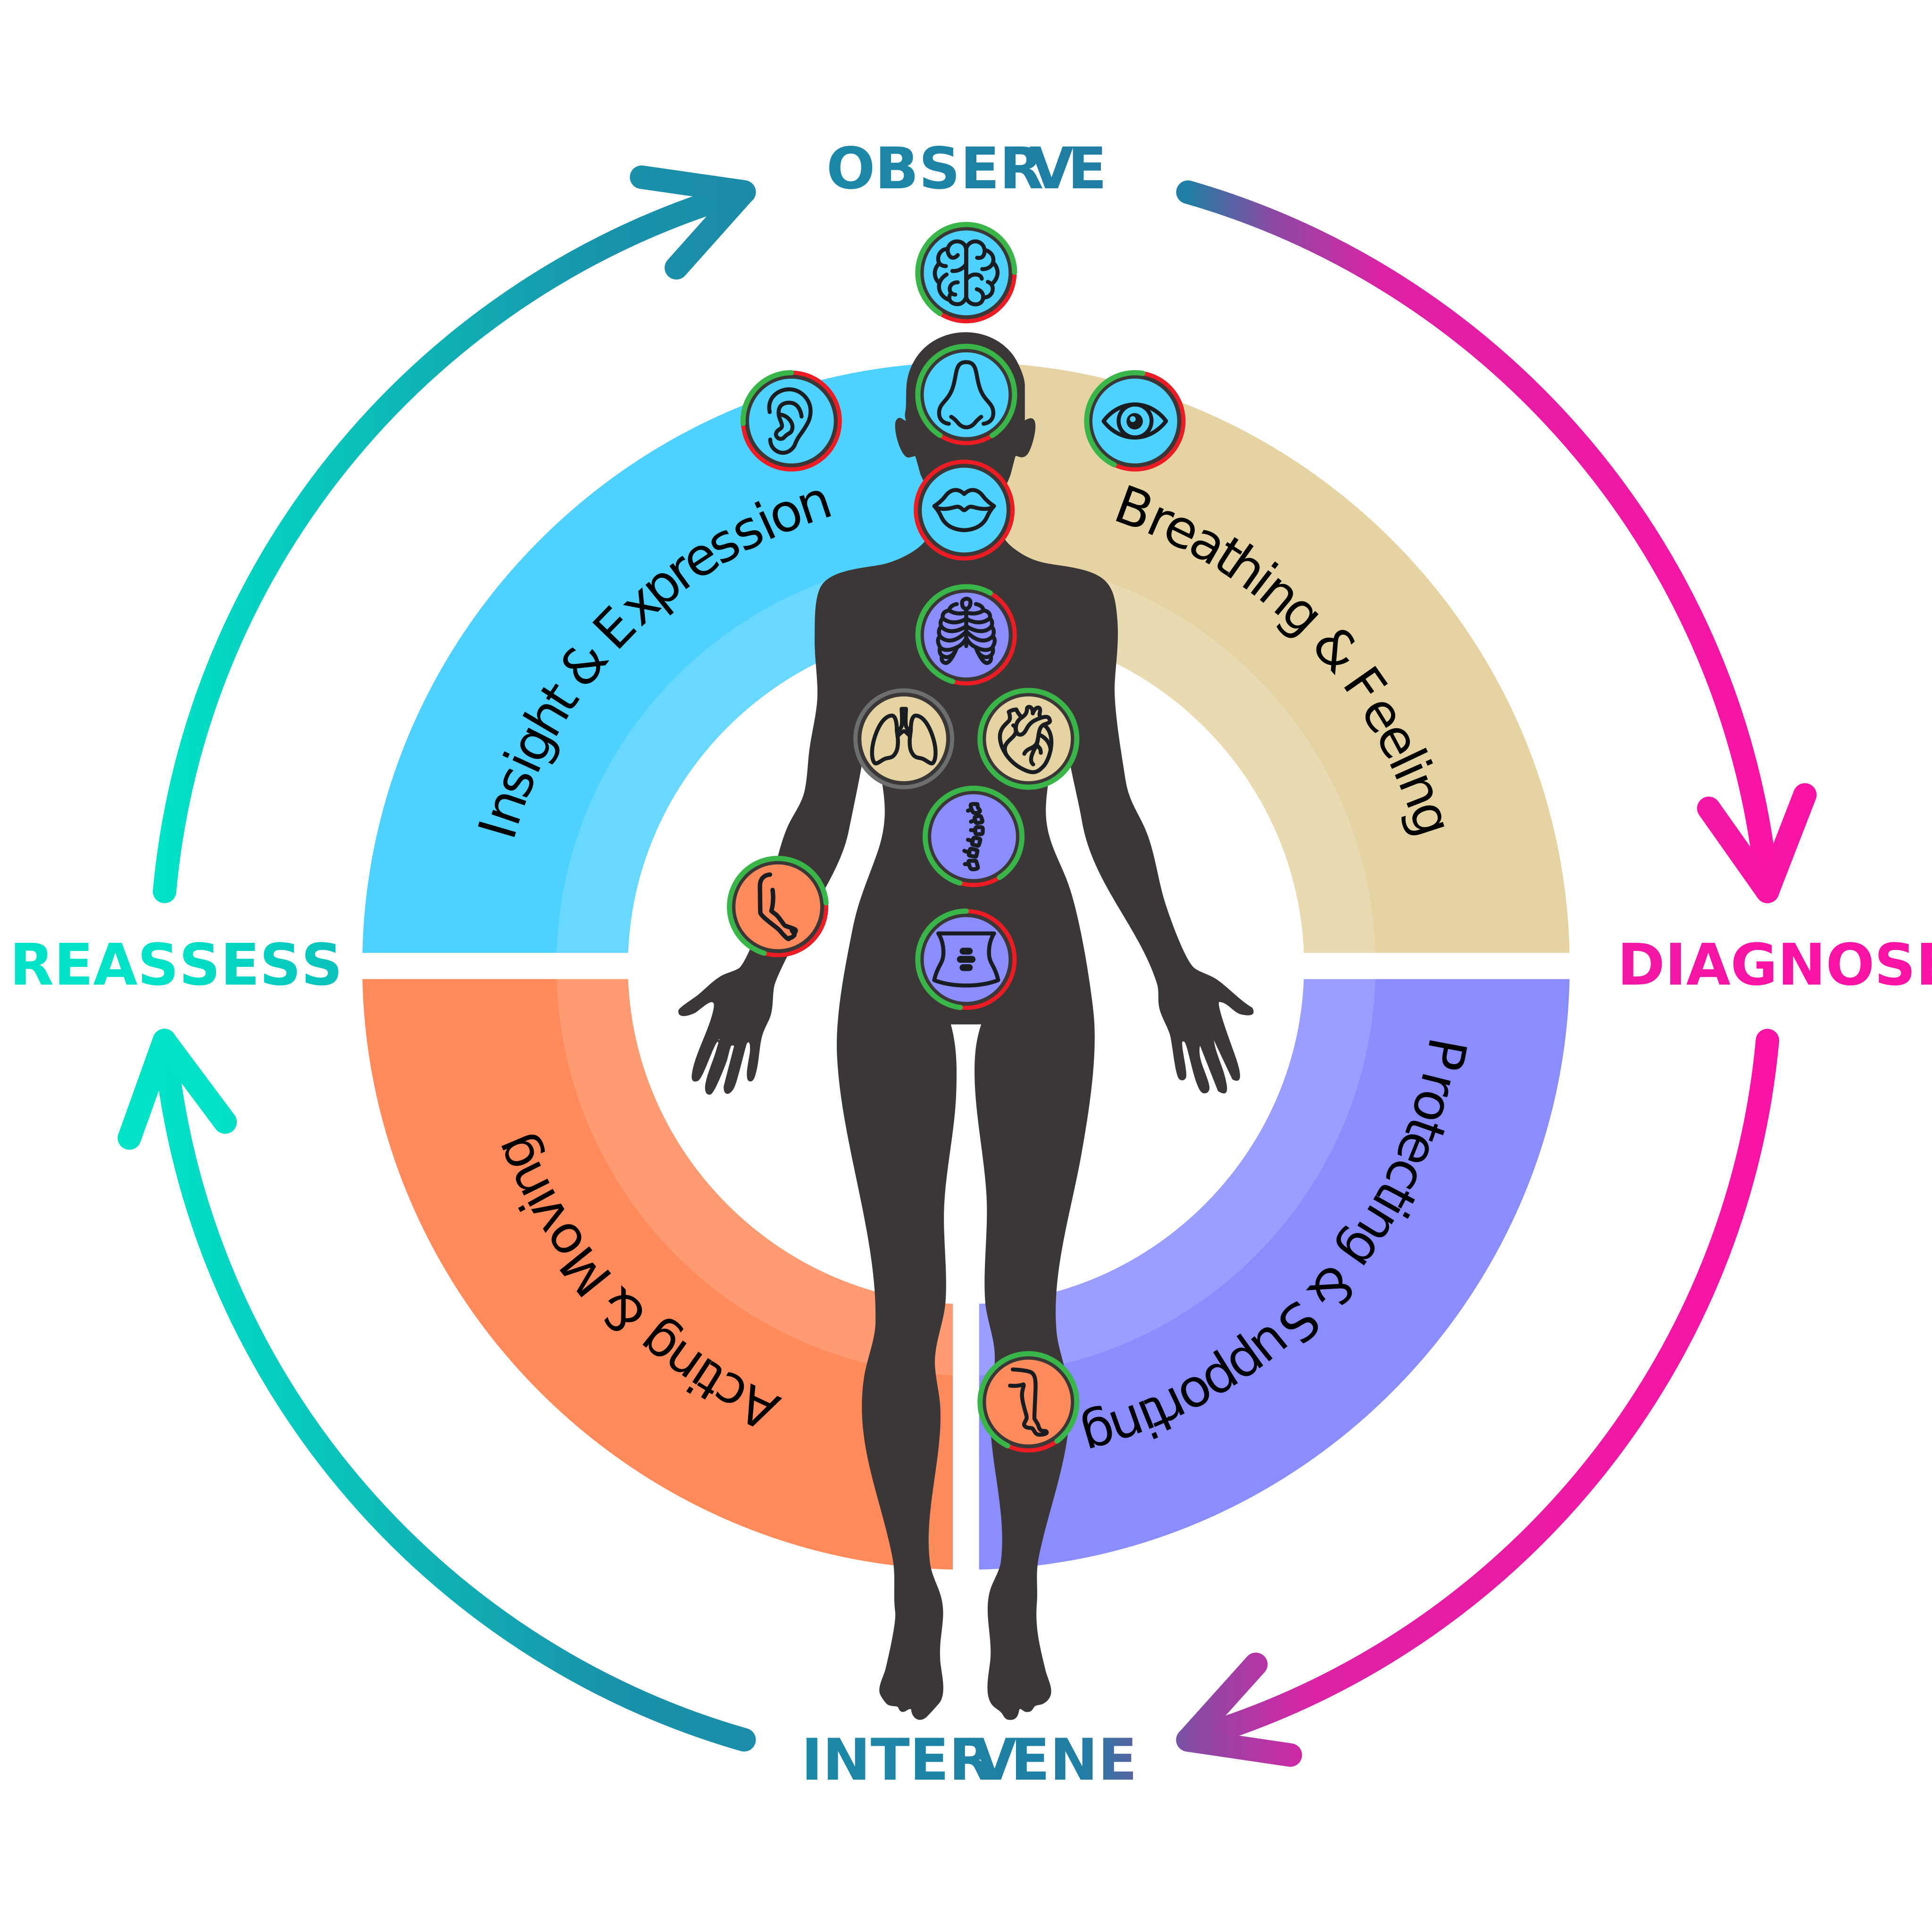
Four cycles that repeat, becoming more accurate and actionable over time, translating the diagnostic framework into the digital platform.
 Diagnostic
See what is happening across the system.
Capture signals of both strain and strength so changes in condition become visible.
 In the
Capture observations from conversations, feedback, data points and metrics, as well as guided in-platform prompts (Inspiration and Guided Input).
DiagnosticInterpret signals in context to understand patterns, root causes and the conditions shaping them.
Turn observation into clarity.
In theLog signals on the Body Map, where they are represented across 12 interconnected areas, making patterns of strength, strain, and connection easier to see.
DiagnosticRespond in a purposeful and coordinated way to influence the conditions behind the signals.
Translate understanding into action.
In theBased on what is revealed, create Treatment Plans to reduce strain and restore balance, or Optimisation Plans to reinforce strength and scale what is working. Each plan is delivered through actions that drive change.
DiagnosticReview how conditions have changed and whether the response is having the intended effect.
In theAfter taking action, use the Pulse Health Check to revisit signals, evaluate progress, and understand whether conditions are reducing, intensifying, stabilising, strengthening, or shifting.

Reassessment does not end the process. It generates new insight that feeds the next cycle of observation.
Through repeated cycles of observation, diagnosis, intervention, and reassessment, we build a deeper understanding of the system and strengthen our ability to adapt, respond and grow.
Signal strength
A system with no readable pulse is just as concerning as one in distress.
Discover your PULSE® maps the full spectrum, from silence to full signal.
No signal. The system is either dormant or the diagnostic layer isn't yet listening.
This is what normal looks like. Any deviation from what is normal becomes a signal. Baseline is the system functioning within normal conditions.
A faint signal is present, with minimal influence.
A noticeable signal is present but limited in impact.
The signal is clearly visible and beginning to influence behaviour.
The signal is significant and actively shaping how the system behaves.
The signal is highly pronounced and represents a dominant condition within the system.